Matthew Wilkens: Geospatial Cultural Analysis and Literary Production

An interview with the DH group at Chicago in advance of my talk there this Friday. Looking forward!

uchicagodhblog's avatardigital humanities blog @UChicago

the distribution of US city-level locations, revealing a preponderance of literary–geographic occurrences in what we would now call the Northeast corridor between Washington, DC, and Boston, but also sizable numbers throughout the South, Midwest, Texas, and California. 
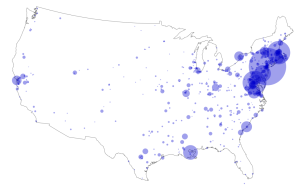
The distribution of US city-level locations, revealing a preponderance of literary–geographic occurrences in what we would now call the Northeast corridor between Washington, DC, and Boston, but also sizable numbers throughout the South, Midwest, Texas, and California.

Matthew Wilkens, Assistant Professor of English at Notre Dame University, will be speaking at the Digital Humanities Forum on March 7 about Geospatial Cultural Analysis and its intersection with Literary Production. Specifically, Wilkens’ research asks: Using computational analysis, how can we define and assess the geographic imagination of American fiction around the Civil War, and how did the geographic investments of American literature change across that sociopolitical event?

We spoke to him about his choice to use a quantitative methodology, the challenges that were consequently faced, and the overall future for the Digital Humanities. This is what he had to say:

What brought you to Digital Humanities methodologies?

I guess it was…

View original post 1,715 more words

Talk at Chicago, March 7, 2014

I’m giving a talk at the University of Chicago Digital Humanities Forum in a couple of weeks. Details at that link and reproduced here. Looking forward to the event and hope to see some of the many cool DH folks in Chicago there.

Date: March 7, 2014
Location: Regenstein Library 122
Time: 12:00-2:00 pm

Abstract: Scholars have long understood that there is a close relationship between literary production and the large-scale cultural contexts in which books are written. But it’s difficult to pin down the many ways in which this relationship might work, especially once we expand our interest from individual texts to systems of production and reception. In this talk, Wilkens offers a computationally assisted analysis of changes in geographic usage within more than a thousand works of nineteenth-century American fiction, arguing that literary-spatial attention around the Civil War was at once more diverse and more stable than has been previously shown. He examines correlations between literary attention and changes in demographic factors that offer preliminary insights into the driving forces behind a range of shifts in literary output. Wilkens also discusses the future of the project, which will soon expand to include millions of books from the early modern period to the present day.

DH Grad Syllabus

The syllabus for my current digital humanities grad seminar is now available. It’ll evolve a bit over the semester, mostly by gaining specific exercises and answers.

I tried to take my own advice from the last time I taught the class as I put together this version; there’s more (and more formal) programming and machine learning, different treatments of the intro to DH and of visualization, more GIS, and (much) less media studies. But if you think there are things I’ve missed, I’d me curious to know. Or, well, I know there are a lot of things I’ve been forced to leave out. Since time remains stubbornly finite, if you think something should be added, what might be cut to make room for it?

New Article in ALH

My article, “The Geographic Imagination of Civil War-Era American Fiction,” is in the latest issue of American Literary History (which happens to be the 100th issue of the journal). The easiest way to get it is probably via Muse (direct link, paywall), though it’s also available from Oxford (publisher of ALH, temporarily free to all). If your institution doesn’t subscribe to either of those outlets, drop me a line and I’ll send you a PDF offprint. I’m really pleased to see the piece in print, especially in an issue with so many people whose work I admire.

The article presents some of my recent work on geolocation extraction in a form that’s more complete than has been possible in the talks I’ve given over the last year or so. There’s more coming on a number of fronts: geographic attention as a function of demographic and economic factors, a wider historical scope, a (much) larger corpus, some marginally related studies of language use in the nineteenth century (with my students Bryan Santin and Dan Murphy), and more. Looking forward to sharing these projects in the months ahead.

Multilingual NER

Last week I finished a fellowship proposal to fund work on geolocation extraction across the whole of the HathiTrust corpus. It’s a big project and I’m excited to start working on it in the coming months.

One thing that came up in the course of polishing the proposal—but that didn’t make it into the finished product—is how volumes in languages other than English might be handled. The short version is that the multilingual nature of the HathiTrust corpus opens up a lot of interesting ground for comparative analysis without posing any particular technical challenges.

In slightly more detail: There are a fair number of HathiTrust volumes in languages other than English; the majority of HT’s holdings are English-language texts, but even 10 or 20% of nearly 11 million books is a lot. Fortunately, this is less of an issue than it might appear. You won’t get good performance running a named entity recognizer trained on English data over non-English texts, but all you need to do is substitute a language-appropriate NER model, of which there are many, especially for the European languages that make up the large bulk of HT’s non-English holdings. And it’s not hard at all to identify the language in which a volume is written, whether from metadata records or by examining its content (stopword frequency is especially quick and easy). In fact, you can do that all the way down to the page level, so it’s possible to treat volumes with mixed-language content in a fine-grained way.

About the only difference between English and other languages is that I won’t be able to supply as much of my own genre- and period-specific training data for non-English texts, so performance on non-English volumes published before about 1900 may be a bit lower than for volumes in those languages published in the twentieth century (since the available models are trained almost exclusively on contemporary sources). On the other hand, NER is easier in a lot of languages other than English because they’re more strongly inflected and/or rule bound, so this may not be much of a problem. And in any case, the bulk of the holdings in all languages are post-1900. When it comes time to match extracted locations with specific geographic data via Google’s geocoding API, handling non-English strings is just a matter of supplying the correct language setting with the API request.

Anyway, fun stuff and a really exciting opportunity …

HTRC UnCamp Keynote

I’m giving a keynote address at the upcoming HathiTrust Research Center UnCamp (September 8-9 at UIUC). My talk aside, the event looks really cool. I attended last year and learned a lot about both the technical details of using the HTRC’s resources and the longer-range plans of the center. Highly recommended if you’re anywhere nearby (or even if you’re not).

There’s more information, including registration info, at the link above. Registration closes August 31. My talk is 8:30 am (central time) on Monday, September 9. Don’t know if it’ll be streamed or otherwise made available at some point. I’ll be talking about the newest results from the literary geography and demographics work, including some full-on statistical modeling of the relationships between geographic attention and multiple socioeconomic variables. Which reminds me that I should put at least some of the prettier pictures up on the blog sometime …

[Update: Abstracts and slides for my talk and for Christopher Warren’s (on the “Six Degrees of Francis Bacon” project) are now available at the conference site linked above.]

Racial Dotmap

A few days back, I tweeted about the Racial Dotmap, a really cool GIS project by Dustin Cable of the Weldon Cooper Center for Public Service at UVa. The map shows the distribution (down to the block level) of US population by race according to the 2010 census. There’s a fuller explanation on the Cooper Center’s site.

The map is fascinating stuff — I lost most of a morning browsing around it. Really, you should check it out. To give you an idea of what you’ll find, here are a couple of screen grabs:

The eastern US (click for live version):

2013 08 17 04 27 00 pm

South Bend, Indiana (with Notre Dame). Not clickable, alas, but you can find it from the main map:
BReGz5 CIAAhOY1 png large

One of the things that’s especially appealing about the project is how open it is. The code is posted on GitHub and the underlying data comes from the National Historical Geographic Information System. That fact, along with a suggestion by Nathan Yau of FlowingData, made me wonder how much effort would be involved in creating a version of the map that would allow users to move between historical censuses. It would be really helpful to have an analogous picture for the nineteenth century as I work on the evolution of literary geography during that period.

If I were cooler than I am, this would be where I’d reveal that I had, in fact, created such a thing. I am not that cool. But I wanted to flag the possibility for future use by me or my students or anyone else who might be so inclined. I’m thinking of at least looking into this as a group project for the next iteration of my DH seminar.

I can imagine two big difficulties straight away:

  1. You’d need to have historical geo data, particularly block- or tract-level shapefiles. I have no idea how much the census blocks have changed over time nor whether such historical shapefiles exist. Seems like they should, but …
  2. You’d need the historical census info to be tabulated and available in a way that allows it to be dropped into the existing code or translated into an analogous form. I haven’t looked at that data, so I don’t know how much work would be involved.

Anyway, the Racial Dotmap is a great project to which I hope to be able to return in the future. In the meantime, enjoy!

Update: Mostly for my own future reference, see also MetroTrends’ Poverty and Race in America, Then and Now, which focuses on people below the poverty line and has a graphical slider to compare geographic distributions by race from 1980 through 2010. Click through for the full site.

Poverty Race Screenshot