
As promised yesterday, here are a few plots of the distribution of literary titles in the Gutenberg corpus by the date of their authors’ birth. Producing these was as much a way for me to play with ggplot2 (written my colleague Hadley Wickham in the statistics department here at Rice) as anything else, but the results are interesting, too.
(Note that in all of the following plots, the titles in question are from the Gutenberg catalog as of 22 March 2010. They include only volumes in English with Library of Congress subject codes PR [British literature] or PS [American lit] and with both a determinate author [no blanks, “Anonymous,” “Various,” etc.] and a supplied creator birth year. No further curation was performed. There are 3380 PS titles and 3145 PR titles that fit this description. These numbers are somewhat greater than those in yesterday’s post, because I didn’t do any manual de-duping. In any case, when I talk about “Gutenberg” below, be aware that I’m only addressing this specific, literary, English-language subset of the full 30,000+ volumes in the corpus.)
First up, histograms by decade (click to embiggen):
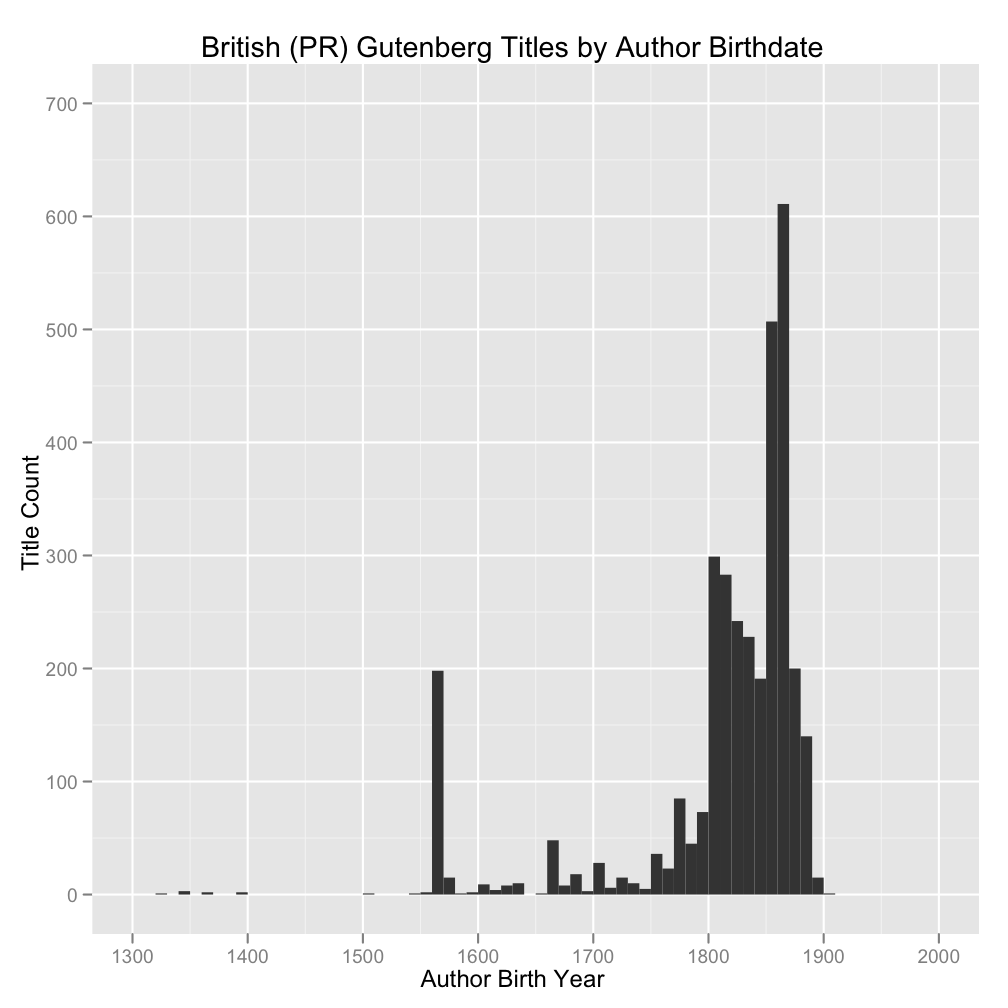
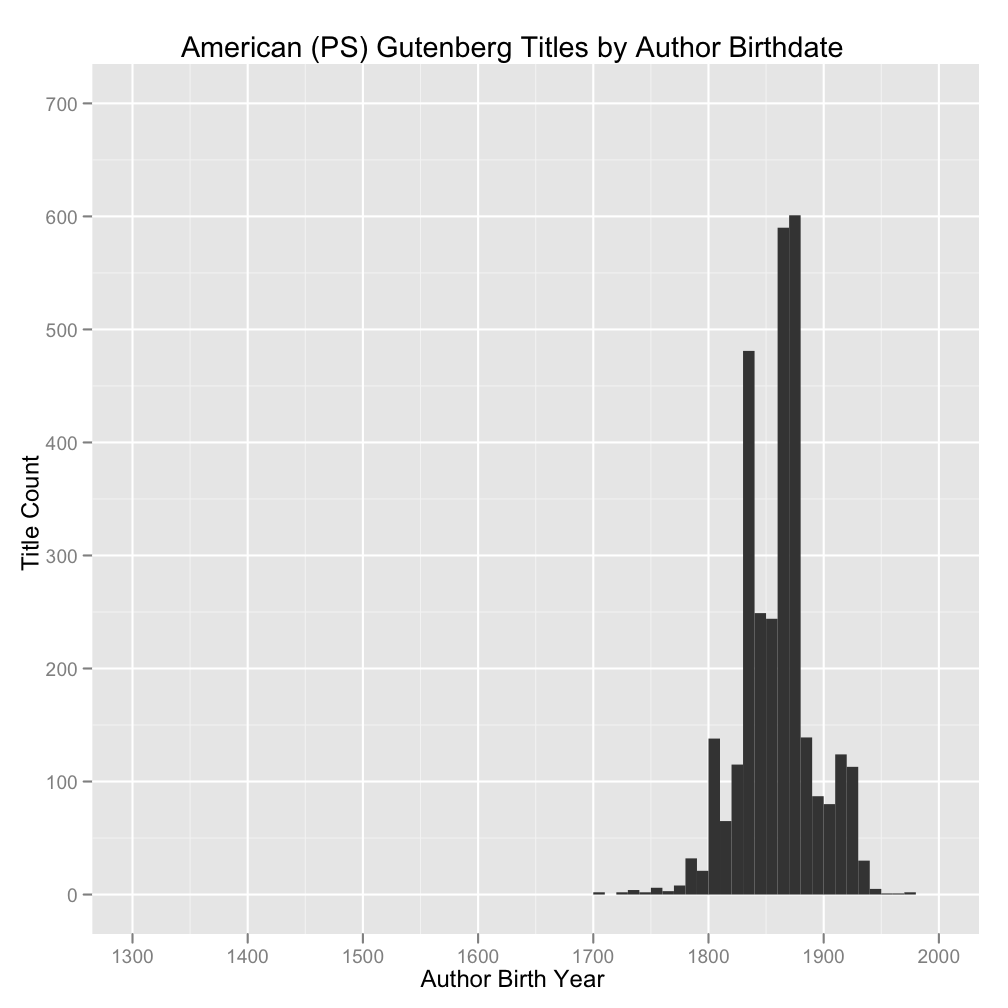
There’s a lot of whitespace in these because I’ve shown the full date range 1300-2000 in order to make direct comparisons between the British and American subsets easier.
No surprise that Gutenberg comprises primarily works by authors born in the nineteenth century. In both cases, there are large but not overwhelming spikes around the 1860s and ’70s. Those (birth) years produced a lot of prolific authors, including those who wrote stories and other multivolume works (we’re tallying volumes, not pages or words). It seems a little late, though, for authors born in these years—and presumably writing mostly in the very late nineteenth and early twentieth centuries—to be cranking out triple-deckers. Will look into this. I suspect it has more to do with a general upward trend in publishing volume over time, a trend that tales off in Gutenberg only because of copyright issues for authors born much later than 1880 or ’90. But I also can’t rule out some sort of other selection effect having to do with Gutenberg’s acquisitions process rather than the underlying literary production of the period. Should talk to Matt Jockers and Franco Moretti about this; they know big-picture numbers about the nineteenth century better than anyone else I know. In any case, the high numbers for the mid-late nineteenth century look to be “real,” by which I mean that there’s no obvious cataloging anomaly or small handful of over-represented authors to explain them away.
For more detail (and slightly niftier plotting), here are the counts for PR and PS volumes by year plotted against one another directly (same story, click to enlarge):
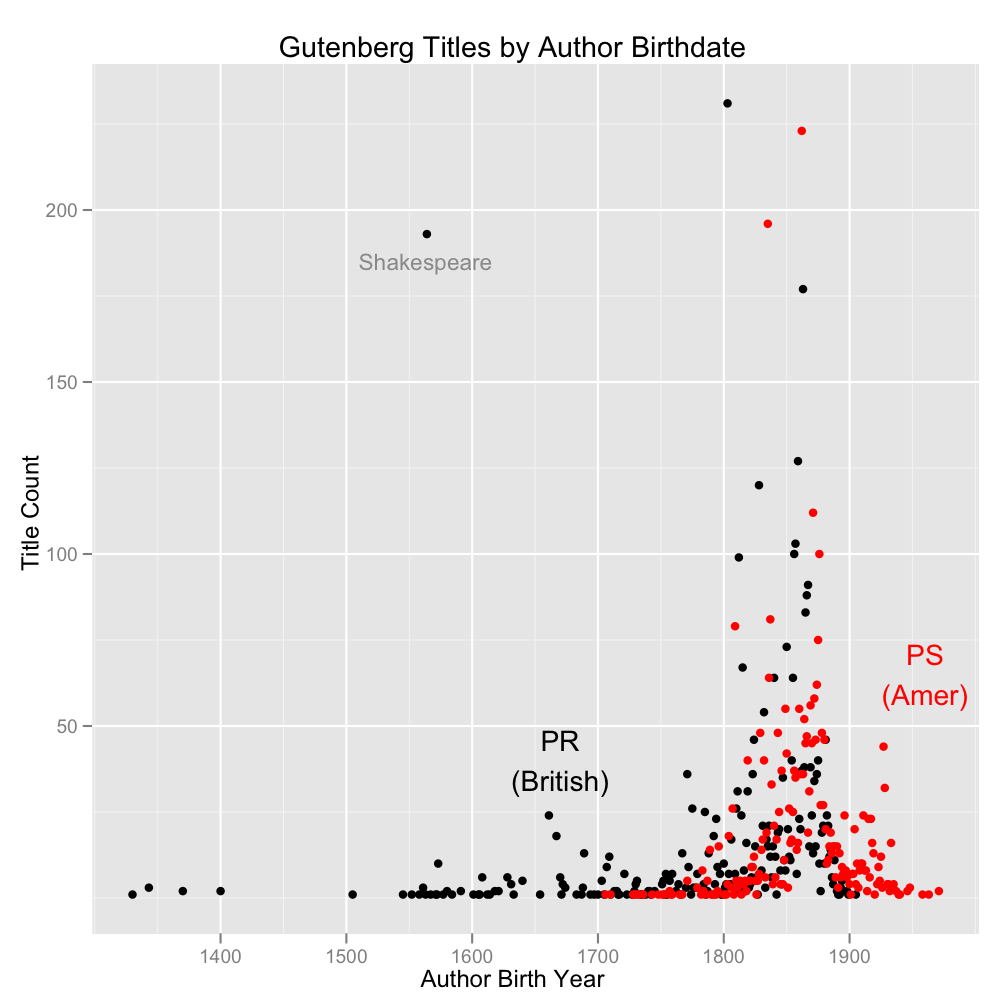
The outliers (with counts above about 125) are the years:
- 1564 (Shakespeare, labeled; Martin Mueller’s not kidding about the extent to which Shakespeare dominates our understanding of the early modern period)
- 1803 (PR; Lytton, mostly, who has lots of multivolume works)
- 1835 (PS; Twain)
- 1862 (PS; Edith Wharton, O. Henry, Gilbert Parker, and others)
- 1863 (PR; W.W. Jacobs, author of many a short story, among others)
How about a more focused version for the years 1700-2000, with smoothed means, to make a core comparison easier?:
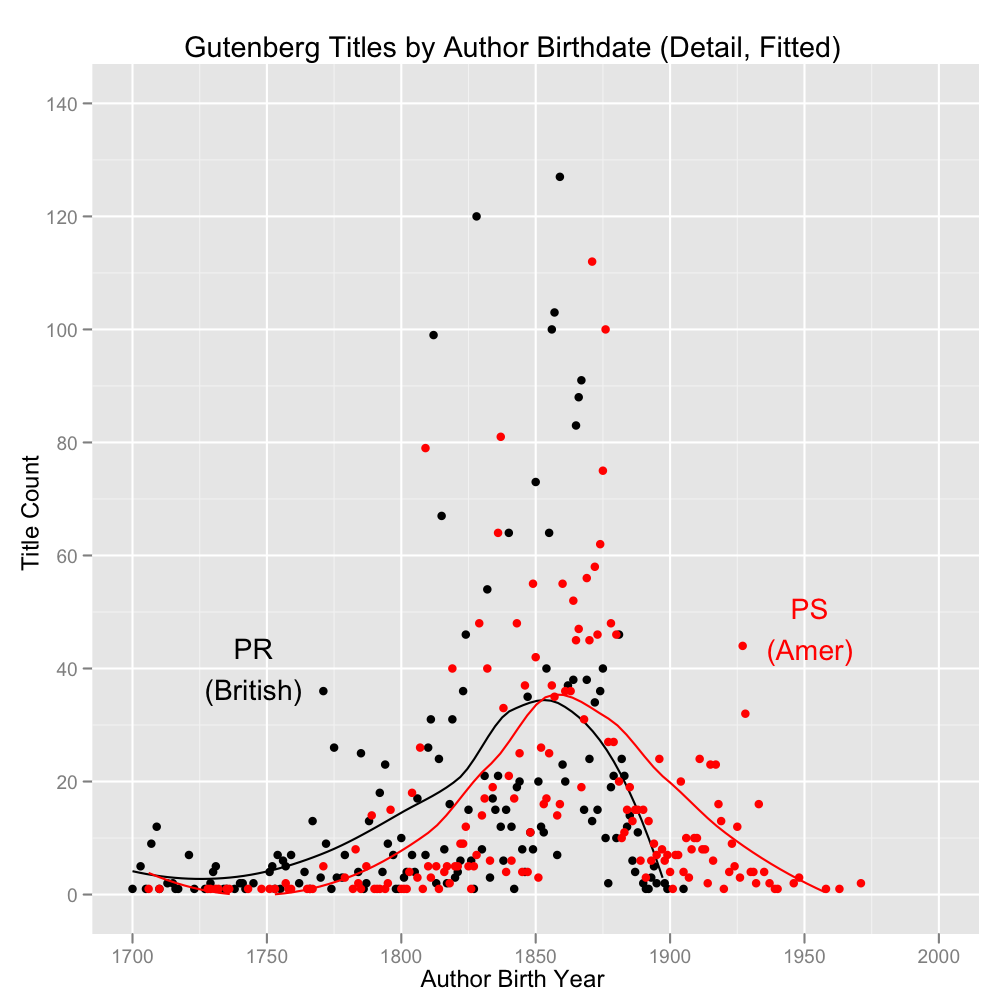
As predicted, the American lit is slightly more recent, on average, than the British. But the difference is small, and it’s mostly down to the presence of comparatively recent work by American (or at least PS-categorized) authors that has entered the public domain one way or another during a period when that wouldn’t happen automatically. Such recent works are totally absent from the British/PR list, which ends with authors born right at the turn of the last century (and not many of those, for obvious copyright-related reasons).
It would be nice to have dates of composition for the works themselves, but that’s not likely to happen without serious additional legwork. In the meantime, author birthdates aren’t all bad; if you make the debatable but not ridiculous assumption that most authors are largely formed in their early careers, you might do just as well grouping their works by “date of maturity” as you would by date of composition. (And you wouldn’t keep trying to shoehorn Henry James into modernism proper, for God’s sake!) Plus, you’d avoid the separate issue of publication dates that don’t line up with composition dates.
Finally, for my own future reference, the (ugly!) R/ggplot2 commands that generated these figures.
The fitted, annotated, detail scatterplot:
qplot(V1, V2, data=pr, xlab="Author Birth Year", ylab="Title Count", main="Gutenberg Titles by Author Birthdate (Detail, Fitted)", xlim=c(1700, 2000), ylim=c(0, 140)) +geom_smooth(data=pr, color="black", alpha=0) +geom_point(data=ps, color="red") +geom_smooth(data=ps, color="red", alpha=0) +annotate("text", x=1564, y=185, label="Shakespeare", size=4, alpha=0.4) +annotate("text", x=1955, y=55, label="PS\n(Amer)", color="red") +annotate("text", x=1745, y=40, label="PR\n(British)")
pr and ps are hash-like lists of author birth years and corresponding counts of volumes for that year, one year/count pair per line.
The histograms are similar but easier, involving variations on something like:
qplot(V1, data=pshist, geom = "histogram", binwidth=10, main="American (PS) Gutenberg Titles by Author Birthdate", xlab="Author Birth Year", ylab="Title Count", xlim(1300, 2000), ylim(0, 700))
Where pshist is just an unsorted list of author birth years, one for each volume (in this case, each PS volume) in the catalog (so yes, lots of repeats, which is the point).
